
Earned Target Share
Quantifying How Teams Force-Feed Skill Players Targets


Fantasy football boils down to one statistic: volume.
The most powerful predictor of a player’s output in any given game is the number of times he touches the ball. Some of that predictive power exists because a touch is almost guaranteed to produce positive yardage: the primary element of a player’s fantasy point total. The rest of the power results from American football’s play-by-play structure. Touchdowns, which generate the largest fantasy point haul of any single event, can only occur once per play. Maybe that sounds a bit obvious, but the ramifications are enormous. If a player only touches the football once in a game, he can score a finite amount of touchdowns—one, to be exact. Thus, even when using scoring systems that don’t allocate points to the touch itself, fantasy players are strongly incentivized to follow the volume.1
An obscene amount of effort goes into forecasting touches for skill position players, especially on the fringes. Because of the paucity of samples, DFS players are forced to fall back on reading the tea leaves of beat reports and coach-speak. When an obvious opportunity for increased volume appears (think Zach Moss stepping in for Jonathan Taylor last year), the field clicks the player into lineups at an astonishing rate. In the December 3rd Mini-Max, 64% of all lineups included Zack Moss.2 3
But the danger posed by Zack Moss, and the host of other players stepping up for injured starters, is that they’re easy to identify. And when something is easy to identify, it has almost no value in DFS.
In the first place, there’s the obvious mathematical problem. You win a DFS contest by scoring higher than your competition. Scoring an equal number of points as your competition leaves you in the same place you were at kickoff for the morning slate: tied. Free squares in Bingo don’t help any particular player win, they just weed out folks who don’t have complete information for the slate.
In the second place, easy-to-identify phenomena have a nasty habit of being incorrectly identified. Human beings love telling themselves stories. And the easier a story is to tell, the more folks will tell it to themselves. Zach Moss’s workload increase was a real simple narrative to spin. It was also easy to imagine Tyreek Hill’s Week 13 performance against Washington would be his best of the season. It wasn’t.4
Edges emerge by stripping away narrative and easy storytelling and allowing numbers to show us a set of possible outcomes (I sometimes call them “worlds”). From this set of outcomes, a fantasy player can build a robust portfolio of lineups that have teeth precisely because large chunks of the field will prefer the story, ignoring the breadth of possibilities.
Earned Target Share
For some time now, I’ve been mulling over the idea that skill players “earn” their target volume. In one sense, earned targets are almost a self-evident fact. Coaches only let talented players put their cleats on the field, a necessary condition for getting gloves on the ball. But there’s more to it than that. Receivers don’t get all of their looks from the QB just because they’re on the field:
Receivers can run the primary route on any given pass play, or not.
When a play breaks down, a quarterback will start to look for the best set of hands to hurl the ball towards.
When there’s a split-second decision about whether or not to move through read progression, a passer’s confidence in a receiver must play an important, albeit subliminal, role in the final call.
Consequently, I began to play around with a metric I’ve taken to calling “Earned Target Share”—a bit of a bland name, but it gets the job done. It’s a single-player game-level statistic, meaning that for each game an individual player participates in, that player will have an Earned Target Share.
The metric aims to capture how much a franchise is forcing targets at a particular skill player, over and above what a player’s other usage stats would indicate. I say franchise, because a large number of factors apply pressure on the outcome of individual snaps—it’s not just the QB. The offensive coordinator, head coach, and other elements also play a role.
Earned Target Share is a player’s actual target share minus the target share that player should have had. Of course, “should” is doing a universe of work in that sentence. Here’s what that loaded word means, along with an explanation of how the statistic is calculated.
Calculating Earned Target Share
All that “should” means is “would have expected given some data about other things happening on the field.” To make it more concrete: “Justin Jefferson should have gotten more looks given how many routes he ran”. That’s the exact starting place of Earned Target Share, the percentage of a team’s targets we’d have expected a player to draw given that player’s usage.
Thanks to the efforts of several smart, dedicated fans and analysts, measurements of play-by-play and game-by-game outcomes are readily accessible. Data about completion probability, expected passes, air yards (the receiving/passing yards that are not yards after the catch), and win probability are all available for free. We can use this information to define a relationship between how players are used on the field in particular games, and their corresponding target share. This relationship will allow us to define what percentage of targets we can expect a typical player being used in some given manner to see.
So how do we connect those dots? Mathematics and machine learning offer a lot of viable tools, but for this task I wanted to use something supremely simple and (oddly enough) not too powerful. Why eschew machine learning muscle? Because I want to ensure that the tool discovers a generalizable relationship between skill players’ usage and their target share. If the tool for finding that connection has too much horsepower, it’ll probably just “memorize” whatever data it uses to learn. That result is a bit like teaching a student by drilling the answers to a test and not studying the relevant subject. The student will crush that specific test and bomb out on every other challenge.
A tool called ridge regression ended up being my final candidate. I won’t go into the inner workings of the math, but the key characteristic of ridge regression is that it’s proficient at ignoring outlier cases.
For illustration, imagine our ridge regression model teaching itself to predict target share, learning from the last three seasons of data. Last year in Week 6, Stefon Diggs logged around 55% of all Bills targets. The average for all pass-catchers is about 13%, for context.
A ridge regression model is unlikely to learn a special rule just to account for this isolated instance. Instead, it’ll focus its study on the majority of cases. As a result, the model’s predicted share percentages will stay close to a typical player’s target share and avoid “hot takes”.
Once we have a model that can predict target share, we’re left with a tool that takes facts about a player’s usage, and tells us what a typical player’s target share should look like given that usage. So—we have a tool that tells us what a player’s target share in a specific game “should” have been.
Here’s CeeDee Lamb’s predicted target share in each game he played last year:
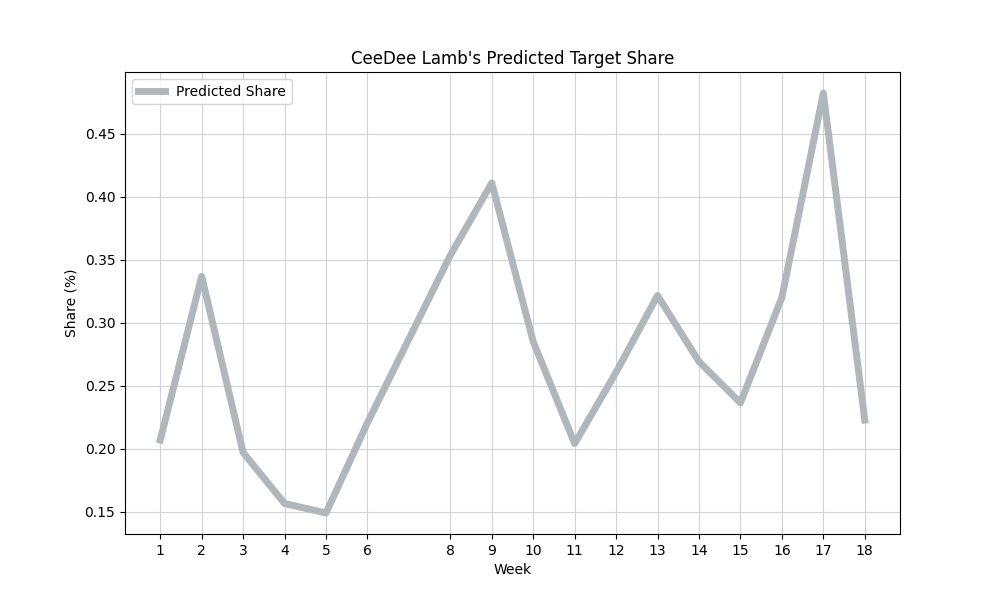
Remember, that’s the predicted target share, the target share he should have seen. Here’s the same graph again, with actual target share included:
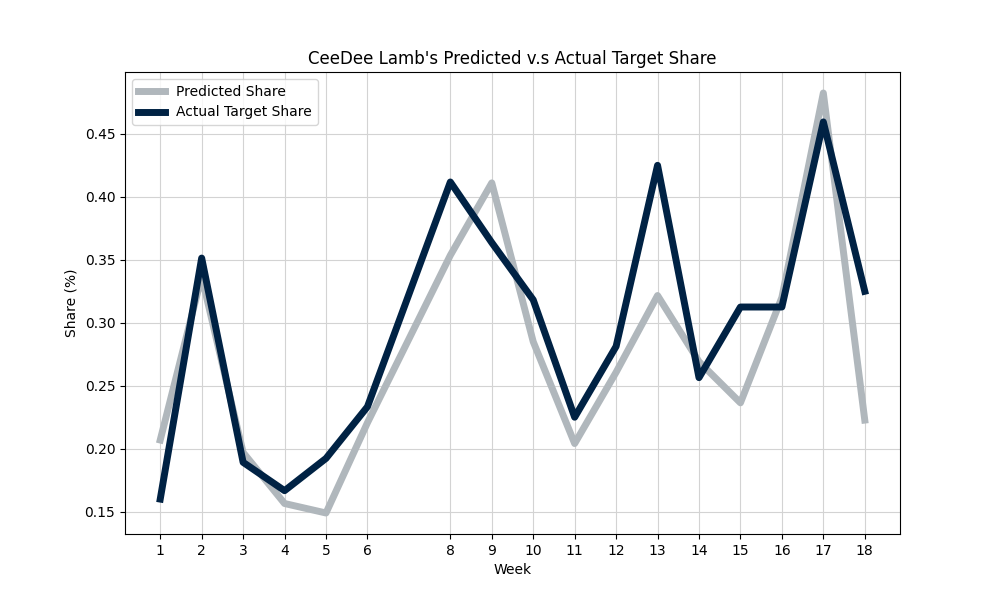
Over the course of all games played, CeeDee averaged about 2% more of his team’s targets than you’d expect based on his usage. Is that a lot? No. It didn’t even crack the top 20 averages for 2023, actually.5 That failure to crack the top 20 doesn’t mean that CeeDee Lamb is a bad a player or a bad fantasy option. The 2% doesn’t mean anything negative at all. Nor, conversely, does it mean anything positive.
What does Earned Target Share tell us?
A lot! It tells us what we set out to know—which players franchises funnel their air game through. Here’s a slice of the top ten players in average Earned Target Share last year:
If you’re familiar with the names on this board, their presence there likely won’t surprise you. Stefon Diggs, Adam Thielen, and Davante Adams were obvious superstars on teams hurting for pass-catching talent. And Barkley is the definition of a target funnel.
CeeDee Lamb’s 2% Earned Target Share just means that he’s not getting force-fed targets. Let’s be clear: No. 88 gets called on a lot. In three of his 2023 outings, he was the destination for over 40% of Dallas’s pass attempts. He doesn’t have a high Earned Target Share because his usage indicates he SUPPOSED to see that kind of target share. Cooper Kupp, Puka Nacua, Amari Cooper, Deebo Samuel—these guys get fed, they just don’t get fed more than you’d expect given their playing style and snap counts.
Applications for Fantasy
Without spending a lot of time picking through possibilities and conducting tests, it’s tough to be sure about the best use of the metric. But I can confidently say that it’s helpful for understanding whose fantasy value is influenced by force-fed targets.
For example, let’s take the top WR in ETS: Stefon Diggs. Here’s Diggs’s target share graph for 2023, depicting both predicted and actual targets:
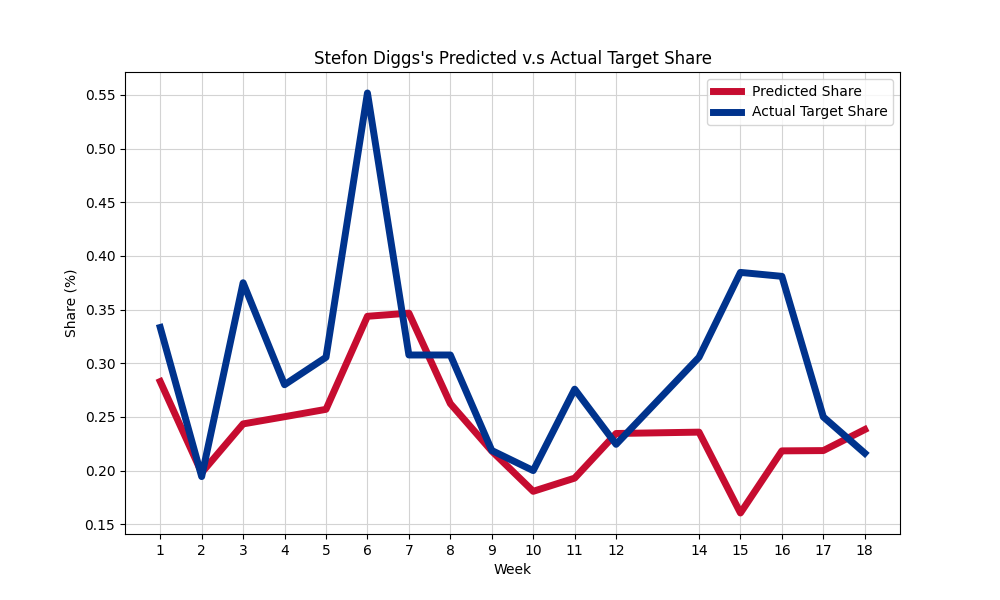
Remember: if the “actual” line is above the “predicted” line, the player logged a positive ETS for that week. If the “actual” line is way above the predicted line, the player registered a really high ETS. As we might expect based on his high ETS, Diggs pretty consistently claims more of the Bill’s targets than his usage indicates.
But Diggs won’t be catching passes from Josh Allen this September; he’s been acquired by the Houston Texans. That franchise’s new signal caller, C.J. Stroud, is the league’s hot hand. Here’s Stroud’s top two wide receivers by volume—notice any difference in the charts?
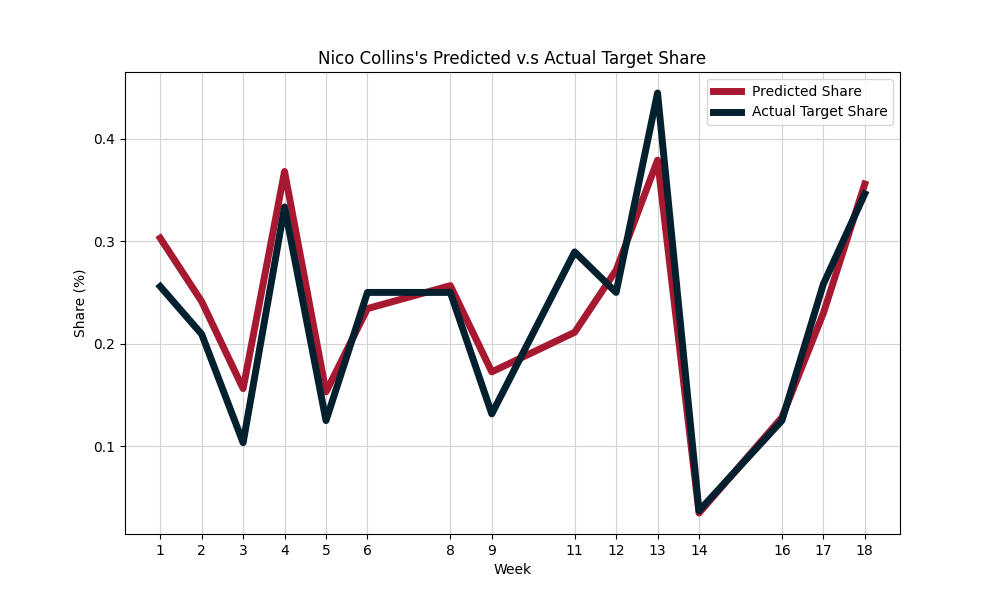
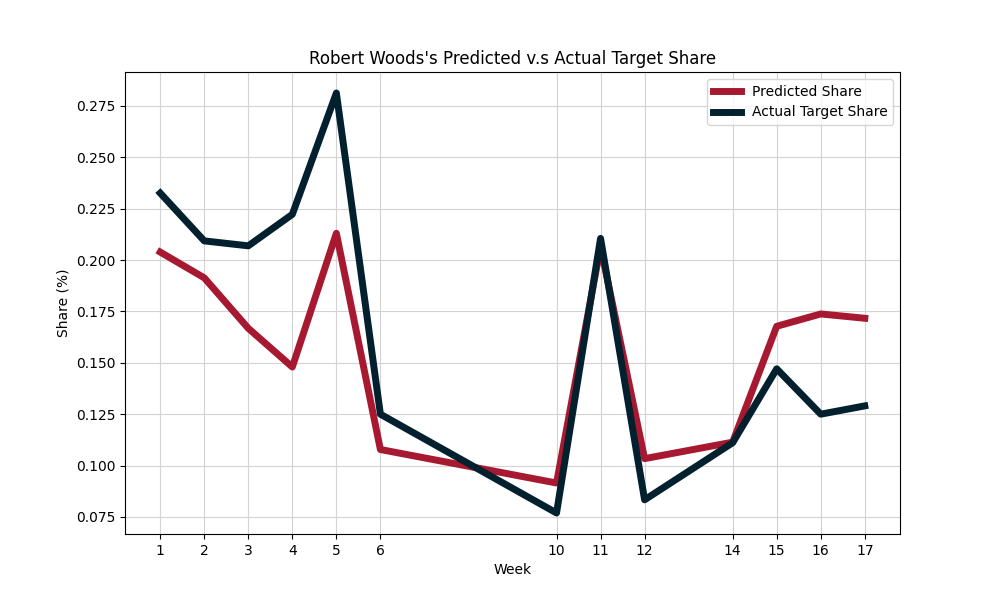
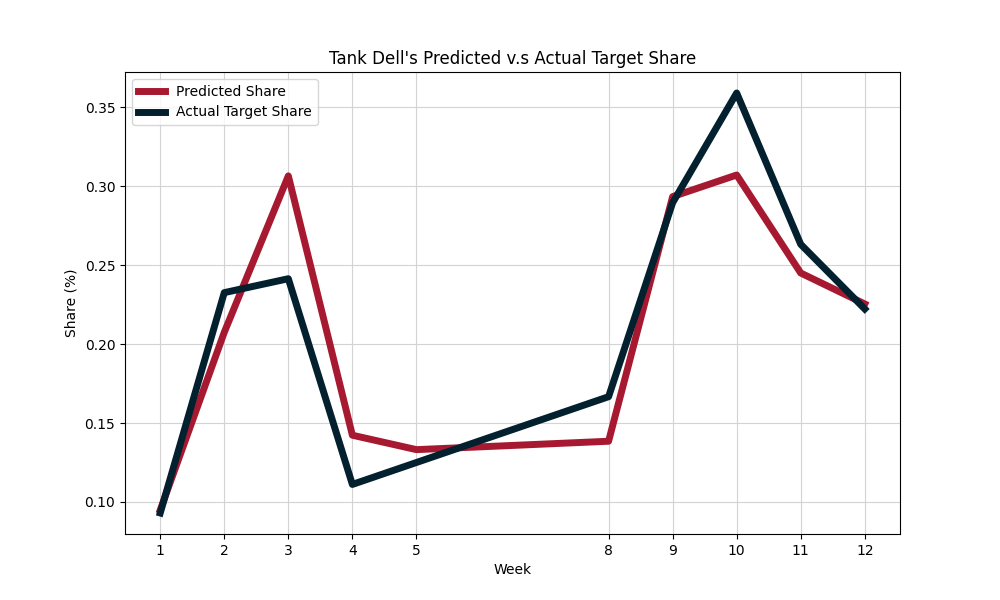
There’s just not a ton of examples of top Texans receivers logging dramatic ETS numbers (which Diggs did three or four times). And aside from early season Robert Woods, Stroud’s top two didn’t maintain even a high-ish ETS with consistency.
Does that mean that Diggs is a bad early-season DFS play, or a poor draft pick? Nope. But it does mean trusting that all of his production to translate across teams requires an assumption that the Texans will change the way they play. I, for one, do not believe that is likely to happen. Neither does most of the market.
Diggs is the illustration here because he’s a bit of an obvious case. The point of computing these statistics across the entire player base is identifying cases that are less noticeable, less easy of a story to tell. For an example like that—how confident can we feel in Jaylen Warren given the QB change in Pittsburgh? A lot of Warren’s production is assignable to ETS, and is it a sure thing that the Wilson/Fields chimera will feel Warren has actually earned that volume? Even if Warren’s on the field usage doesn’t change, regression to the mean is a distinct possibility.
Looking Ahead to 2024
As with any football season, it’ll be tough to have a solid sense of who’s “in” with new QB or coaching regimes until multiple weeks elapse. But as DFS (and season-long) players slog through that swamp of uncertainty, ETS offers a way to quantify what we can see on the screen from squads like Pittsburgh, Atlanta, Denver, Washington, etc.
And for folks like me who have an interest in building useful game-level simulations, ETS offers a way to teach simulation models to differentiate between an expected target and a force-fed one.
Folks reading this article are likely to know this already, but DraftKings’ NFL contests are scored using the Point Per Reception (PPR) schema. One point is scored for each reception.
Unless stated as in fn. 2, all data is from the nflverse python project: https://pypi.org/project/nfl-data-py/.
Credit for stats on this goes to Pro Football Reference. It was still an incredible performance, just not the best stat line of the year for No. 10.
For players who averaged at least 25% of their team’s offensive snaps. There’s a couple of names with stupid high differentials, and I guarantee 99 out of 100 folks who tune in on Sunday could not tell you which franchise they play for.